%402x.svg)
Charles M. Nolan Jr. | CA DRE #02223634 | First Team Real Estate
Executive summary
Direct answer: Riverside County does not have one growth leader. Using verified population endpoints from the California Department of Finance, Beaumont leads percentage growth among the ten city leaders displayed from the verified 2012 baseline to provisional 2026, while Menifee added the most residents among those same leaders. Riverside County also outpaced California across the verified endpoints.
Murrieta adds a separate housing supply signal. The U.S. Census Bureau Building Permits Survey shows 1,666 residential units authorized in 2025, up from 114 in 2024 and below the extracted 2004 peak of 3,081. About 95.9 percent of the 2025 authorized units were in structures containing five or more units. These are permit authorizations, not completed homes.
Why this matters
The phrase growth can describe several different things. Percentage growth tells you how quickly a place changed relative to its starting size. Raw population gain tells you how many residents were added. Building permits describe authorized housing activity that may move into later stages of production.
Those distinctions change the answer to practical questions. A resident may want to know how quickly a city is changing. A buyer or owner may want to understand the broader housing context. A housing professional may need to separate demographic growth from future supply. A public agency may need to distinguish the rate of change from the scale of service and infrastructure demand.
The key is to use each measure for the question it can actually answer. Population growth and permit authorizations provide context. They do not, by themselves, establish home price direction, property value, affordability, completed supply or future demand.
Want to see how these growth signals connect to a specific Riverside County city? Explore the CMN Research Library.
Key Takeaways
- Beaumont leads percentage growth among the displayed city leaders. Using verified population endpoints from the California Department of Finance, CMN calculates growth of about 54.2 percent from the verified 2012 baseline to provisional 2026.
- Menifee added the most residents among the displayed leaders. CMN calculates an increase of 37,258 residents over the same endpoint comparison.
- Riverside County outpaced California across the verified endpoints. Riverside County reaches about 112.54 on a 2012 equal to 100 endpoint index by provisional 2026, compared with about 105.08 for California.
- Murrieta’s 2025 permit rebound was large, but it was not a record. The U.S. Census Bureau Building Permits Survey shows 1,666 residential units authorized in 2025, up from 114 in 2024 and below the extracted 2004 peak of 3,081.
- The composition of Murrieta’s authorization total matters. Of the 1,666 authorized units in 2025, 1,598 were in structures containing five or more units, or about 95.9 percent. Permit authorization does not establish completion, occupancy, sales or market availability.
What is the direct answer about Riverside County growth?
Riverside County is growing, but the answer to where growth is happening fastest depends on the measure.
Using verified population endpoints from the California Department of Finance, Beaumont leads percentage growth among the ten Riverside County city leaders displayed from the verified 2012 baseline to provisional 2026. Menifee added the most residents among those same leaders. At the broader level, Riverside County outpaced California across the verified endpoints. Murrieta adds a separate housing supply signal through its 2025 permit authorizations.
These measures answer different questions. Percentage growth tells you how quickly a place changed relative to its starting size. Raw resident gain tells you how many people were added. Building permits describe authorized housing activity, not completed supply.
Which Riverside County cities grew fastest from 2012 to 2026?
From the verified 2012 baseline to provisional 2026, Beaumont’s population increased about 54.2 percent. Menifee increased about 46.2 percent, Lake Elsinore about 40.5 percent, Calimesa about 36.8 percent and Eastvale about 26.9 percent.
That ranking answers a percentage growth question. It does not tell you which city added the most people.
Menifee added 37,258 residents in the chart dataset, more than any of the other ten city leaders displayed. Beaumont grew faster relative to its starting size, while Menifee absorbed the larger absolute population gain.
Answer: Beaumont leads percentage growth among the displayed city leaders, while Menifee leads raw resident gain. The rate of change and the scale of change are both useful, but they are not the same measure.
Why can Beaumont lead growth while Menifee added more people?
Percentage growth depends on the starting population. A city that begins with fewer residents can post a larger percentage increase even when another city adds more people in absolute terms.
That distinction matters because the two measures support different decisions. Percentage growth helps show how quickly a community is changing relative to its own size. Raw resident gain helps show the scale of added population that may matter for housing, infrastructure, public services and planning.
Did Riverside County grow faster than California?
Yes, across the verified 2012 and provisional 2026 endpoints.
With Riverside County and California both indexed to 100 in 2012, Riverside County reaches approximately 112.54 by provisional 2026. California reaches approximately 105.08. The gap is roughly 7.46 index points. The current 2026 population estimates are available through the California Department of Finance E 4 population estimates.
Answer: Riverside County grew faster than California over the verified endpoint comparison. That is useful context for the scale of regional change, but it does not by itself predict housing prices, affordability or future demand.
There is an important methodological limit. This is an endpoint comparison, not a seamless annual series. The population estimates cross Census benchmark regimes, so the verified starting and ending points are compared without treating the intervening years as one directly continuous series.
Does faster population growth mean home prices will rise?
No. Population growth is an important housing context measure, but it does not establish price direction, appreciation, affordability, absorption or investment performance by itself.
A property decision requires a different evidence set. Current inventory, comparable transactions, financing conditions, property condition, location and local competition can all matter. The population data helps explain the broader setting. It does not replace property level analysis.
What does Murrieta’s 2025 permit surge mean?
The U.S. Census Bureau Building Permits Survey shows that Murrieta authorized 1,666 residential units in 2025, up from 114 in 2024. The 2025 total was about 5.1 times the 2002 through 2024 annual median of 328.
The rebound was significant, but it was not a record within the extracted history. Murrieta authorized 3,081 units in 2004, 2,845 in 2005 and 2,413 in 2003. The longer history is important because it prevents one large annual increase from being mistaken for an unprecedented event.
Answer: Murrieta’s 2025 permit total is a meaningful upstream housing pipeline signal. It is not evidence that an equal number of homes were completed or became available to buyers.
What kind of housing was included in Murrieta’s permit total?
Of Murrieta’s 1,666 authorized units in 2025, 1,598 were in structures containing five or more units. That is approximately 95.9 percent of the total.
The structure mix changes how the total should be read because most of the authorization activity was concentrated in larger residential structures. It still does not tell us how many of those units started construction, were completed, entered market inventory, sold or became occupied.
Do 1,666 permits mean 1,666 homes will be built?
No. A building permit is an authorization. It is not a construction start, completion, occupied unit, sale or market available home.
Projects can be delayed, redesigned or abandoned after authorization. The evidence in this publication does not establish how many of Murrieta’s 2025 authorized units progressed into later stages of construction or delivery.
The next housing supply question is therefore conversion. How much of the authorized pipeline moves into starts, construction, completions and market available housing?
What does this mean for buyers, owners and housing professionals?
For buyers and residents, the growth data provides context about how Riverside County and selected cities have changed over time. It should not be treated as a forecast for a specific home, neighborhood or price point.
For homeowners and prospective sellers, county and city population growth does not establish the value of an individual property. Current comparable transactions, condition, local competition and delivered housing supply remain separate questions.
For housing professionals, builders and public agencies, the main analytical rule is to separate the signals. Population percentage growth, raw resident gain and permit authorizations describe different parts of the housing system. Combining them into one growth claim can hide more than it explains.
What should readers watch next?
Watch the next population estimate revisions to see whether the city and county comparisons change.
For Murrieta, watch the housing production sequence rather than the permit number alone. That means permits, starts, units under construction, completions, market available homes, sales, absorption, incentives and financing conditions. Then compare those signals with resale inventory, pricing and market time.
If the 2025 authorizations convert into delivered housing, the supply interpretation becomes stronger. If projects stall before completion, the permit surge will have been a weaker market signal than the authorization total suggests.
What is the main Riverside County takeaway?
There is no single growth leader. Beaumont leads percentage growth among the displayed city leaders. Menifee added the most residents among those same leaders. Riverside County outpaced California across the verified endpoints. Murrieta is showing a separate housing pipeline signal through permit authorizations.
The most useful question is not simply where growth is happening. It is what kind of growth is being measured, over what period, and what decision that evidence can actually support.
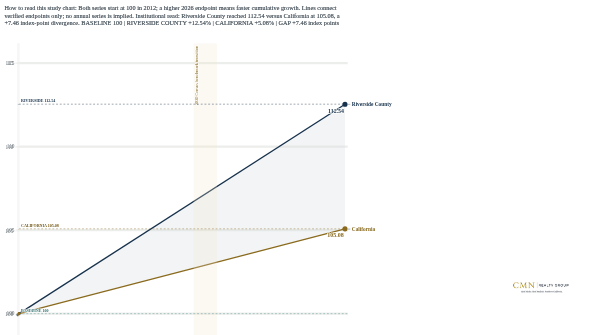
Indexed to 2012 equal to 100, Riverside County reaches about 112.54 by provisional 2026 while California reaches about 105.08, a gap of roughly 7.46 index points. Endpoint comparison only; no seamless annual series is implied.
California Department of Finance E-1 and E-4, plus Riverside County official records. The 2012 baseline reflects estimates after the 2010 Census. The 2026 estimate is provisional and reflects the benchmark regime after the 2020 Census.
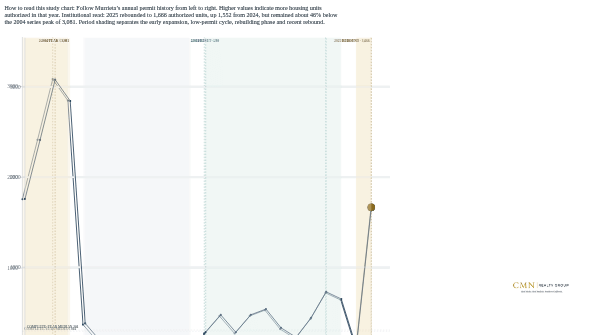
Murrieta authorized 1,666 residential units in 2025, up from 114 in 2024 and about 5.1 times the 2002 through 2024 median of 328, but below the extracted 2004 peak of 3,081.
U.S. Census Bureau Building Permits Survey annual place data, extracted for 2002 through 2025. Reporting month and methodology limitations are disclosed in the publication.
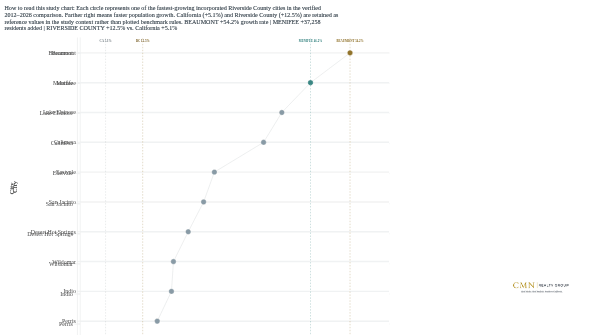
From the verified 2012 baseline to provisional 2026, Beaumont grew about 54.2%, the fastest rate among the ten Riverside County city leaders displayed. Menifee grew about 46.2% and added 37,258 people, the largest raw gain among those leaders.
California Department of Finance E-1 and County of Riverside fiscal year 2013 to 2014 Adopted Budget baseline table. The 2026 Department of Finance estimates are provisional. Top 10 displayed from the verified 28 city universe.
Need the same analysis applied to a specific city, housing question or development decision? Request a focused CMN intelligence brief.
CMN Intelligence Perspective
What is the most useful insight in the growth data?
The identity of the growth leader changes with the question. Beaumont leads percentage growth among the displayed city leaders, while Menifee added the most residents. One measure describes rate. The other describes scale.
Why does Murrieta’s longer permit history matter?
A move from 114 authorized units in 2024 to 1,666 in 2025 is large. The 2002 through 2025 history also shows higher authorization years, including 3,081 units in 2004. The longer series turns an eye catching annual rebound into a more useful historical comparison.
What housing mechanism is CMN watching?
The critical mechanism is conversion. Population growth can increase the need for housing and services, while permit authorizations can signal a potential supply response. The next question is whether authorized units progress into starts, construction, completions and market available housing.
What would change the current interpretation?
Evidence that Murrieta’s 2025 authorizations are converting into completed, market available units would strengthen the supply pipeline interpretation. Material delays, cancellations or weak absorption would weaken it. Comparable resale inventory, pricing, incentives and market time would then be needed to evaluate any competitive effect.
Decision support
If you are making a housing decision in Riverside County
Use population growth and permit activity as context, not as a property forecast. Pair the broader evidence with current inventory, financing, comparable transactions, property condition and local competition before making a decision about a specific home. For the next layer, compare Southern California county market divergence with Riverside County’s current price, sales and inventory signals. Current options can then be reviewed through Property Search or the Buy and New Construction pathway.
If you own a home or may sell
Do not translate county or city population growth directly into a property value conclusion. A specific property still requires current comparable evidence, condition, location and actual competition from resale and delivered new housing. Continue through Sell and Seller Intelligence when the decision becomes seller specific.
If you work in housing, development or planning
Separate percentage growth, raw resident gain and permit authorizations. Long run population change can help frame demographic pressure. Raw gains help show scale. Permit authorizations help identify a potential future supply pipeline. None substitutes for current project, construction or market evidence. Deeper analytical work can continue through Housing Intelligence and Data Visualization or Public Sector and Institutional research support.
What should be monitored next?
Track the next population estimate revision, Murrieta permit activity, construction starts, completions, market available new housing, sales, absorption, incentives, financing conditions and comparable resale inventory. Those later observations will show whether the current signals strengthen, weaken or change direction. Related CMN updates remain organized in the Research Library.
Methodology and data notes
How was the city growth comparison built?
Chart 1 compares the verified 2012 baseline with provisional 2026 population estimates for Riverside County incorporated cities. The displayed chart shows the ten fastest growing cities from the verified 28 city universe. The 2012 baseline comes from a County of Riverside table citing California Department of Finance E 1 population data. The 2026 estimates are provisional and subject to revision. CMN calculates percentage growth and raw population gain from the verified endpoints.
How was Riverside County compared with California?
Chart 2 indexes Riverside County and California to 2012 equal to 100 and compares only the verified 2012 and provisional 2026 endpoints. Riverside County reaches about 112.54 while California reaches about 105.08. The 2012 baseline reflects population estimates after the 2010 Census, while the 2026 estimate reflects the benchmark regime after the 2020 Census. Because the vintages cross Census benchmark regimes, no continuous annual bridge from 2012 to 2026 is implied.
What does the Murrieta permit history measure?
Chart 3 uses U.S. Census Bureau Building Permits Survey annual place data extracted for 2002 through 2025. The chart does not claim that 2002 is the earliest available observation. Murrieta reports fewer than 12 months in 2005 and 2018. Those observations remain visible with methodology disclosure. Census annual estimates can reflect annual reports, summed monthly reports, alternate source data or imputation. Changes in the Building Permits Survey universe and estimation methodology are treated as limitations rather than ignored.
What do building permits not prove?
Building permit authorizations are not construction starts, completions, occupancy, sales, absorption or delivered inventory. Any conclusion about the conversion of authorized units into market available housing requires additional comparable evidence for the same geography and period.
What interpretation limits apply?
Population estimates and permit authorizations are different measures produced by different systems. Neither establishes housing demand, price direction, appreciation, affordability, absorption or investment performance by itself.
Research and educational information only. No fiduciary duties or brokerage representation are created by this publication. DRE #02223634 | First Team Real Estate.
Article Sources
Frequently asked questions
Which Riverside County city grew fastest from 2012 to 2026?
Among the ten Riverside County city leaders displayed, Beaumont grew fastest by percentage at approximately 54.2 percent from the verified 2012 baseline to provisional 2026.
Which displayed Riverside County city added the most residents?
Menifee added 37,258 residents, the largest raw population gain among the ten city leaders displayed.
Did Riverside County grow faster than California?
Yes, across the verified 2012 and provisional 2026 endpoints. Riverside County reaches about 112.54 on a 2012 equal to 100 endpoint index, compared with about 105.08 for California.
What does Murrieta authorizing 1,666 residential units in 2025 actually mean?
It means 1,666 residential units were authorized by building permits. It does not mean 1,666 homes were completed, occupied, sold or made available to buyers. The extracted history also shows a higher total of 3,081 units in 2004.
Does this growth data predict home prices or the value of a specific property?
No. Population growth and permit authorizations provide housing context, but they do not establish price direction, appreciation, affordability or the value of an individual property. Current local and property specific evidence is still required.
What should readers watch next?
Watch future population estimate revisions and whether Murrieta’s permit authorizations progress into starts, construction, completions and market available housing. For a specific housing decision, also watch current inventory, financing, comparable transactions and local competition.
Public agencies and institutional teams can continue through CMN Public Sector and Institutional research support or request a more specific documented analysis through CMN Contact. Research services do not imply government affiliation or endorsement.
Making a housing decision in Riverside County? CMN can translate local population, supply, pricing and market evidence into a focused intelligence brief for the question you are trying to answer. Licensed real estate representation, when requested, is provided separately through First Team Real Estate. Request custom intelligence.

Charles M. Nolan Jr.